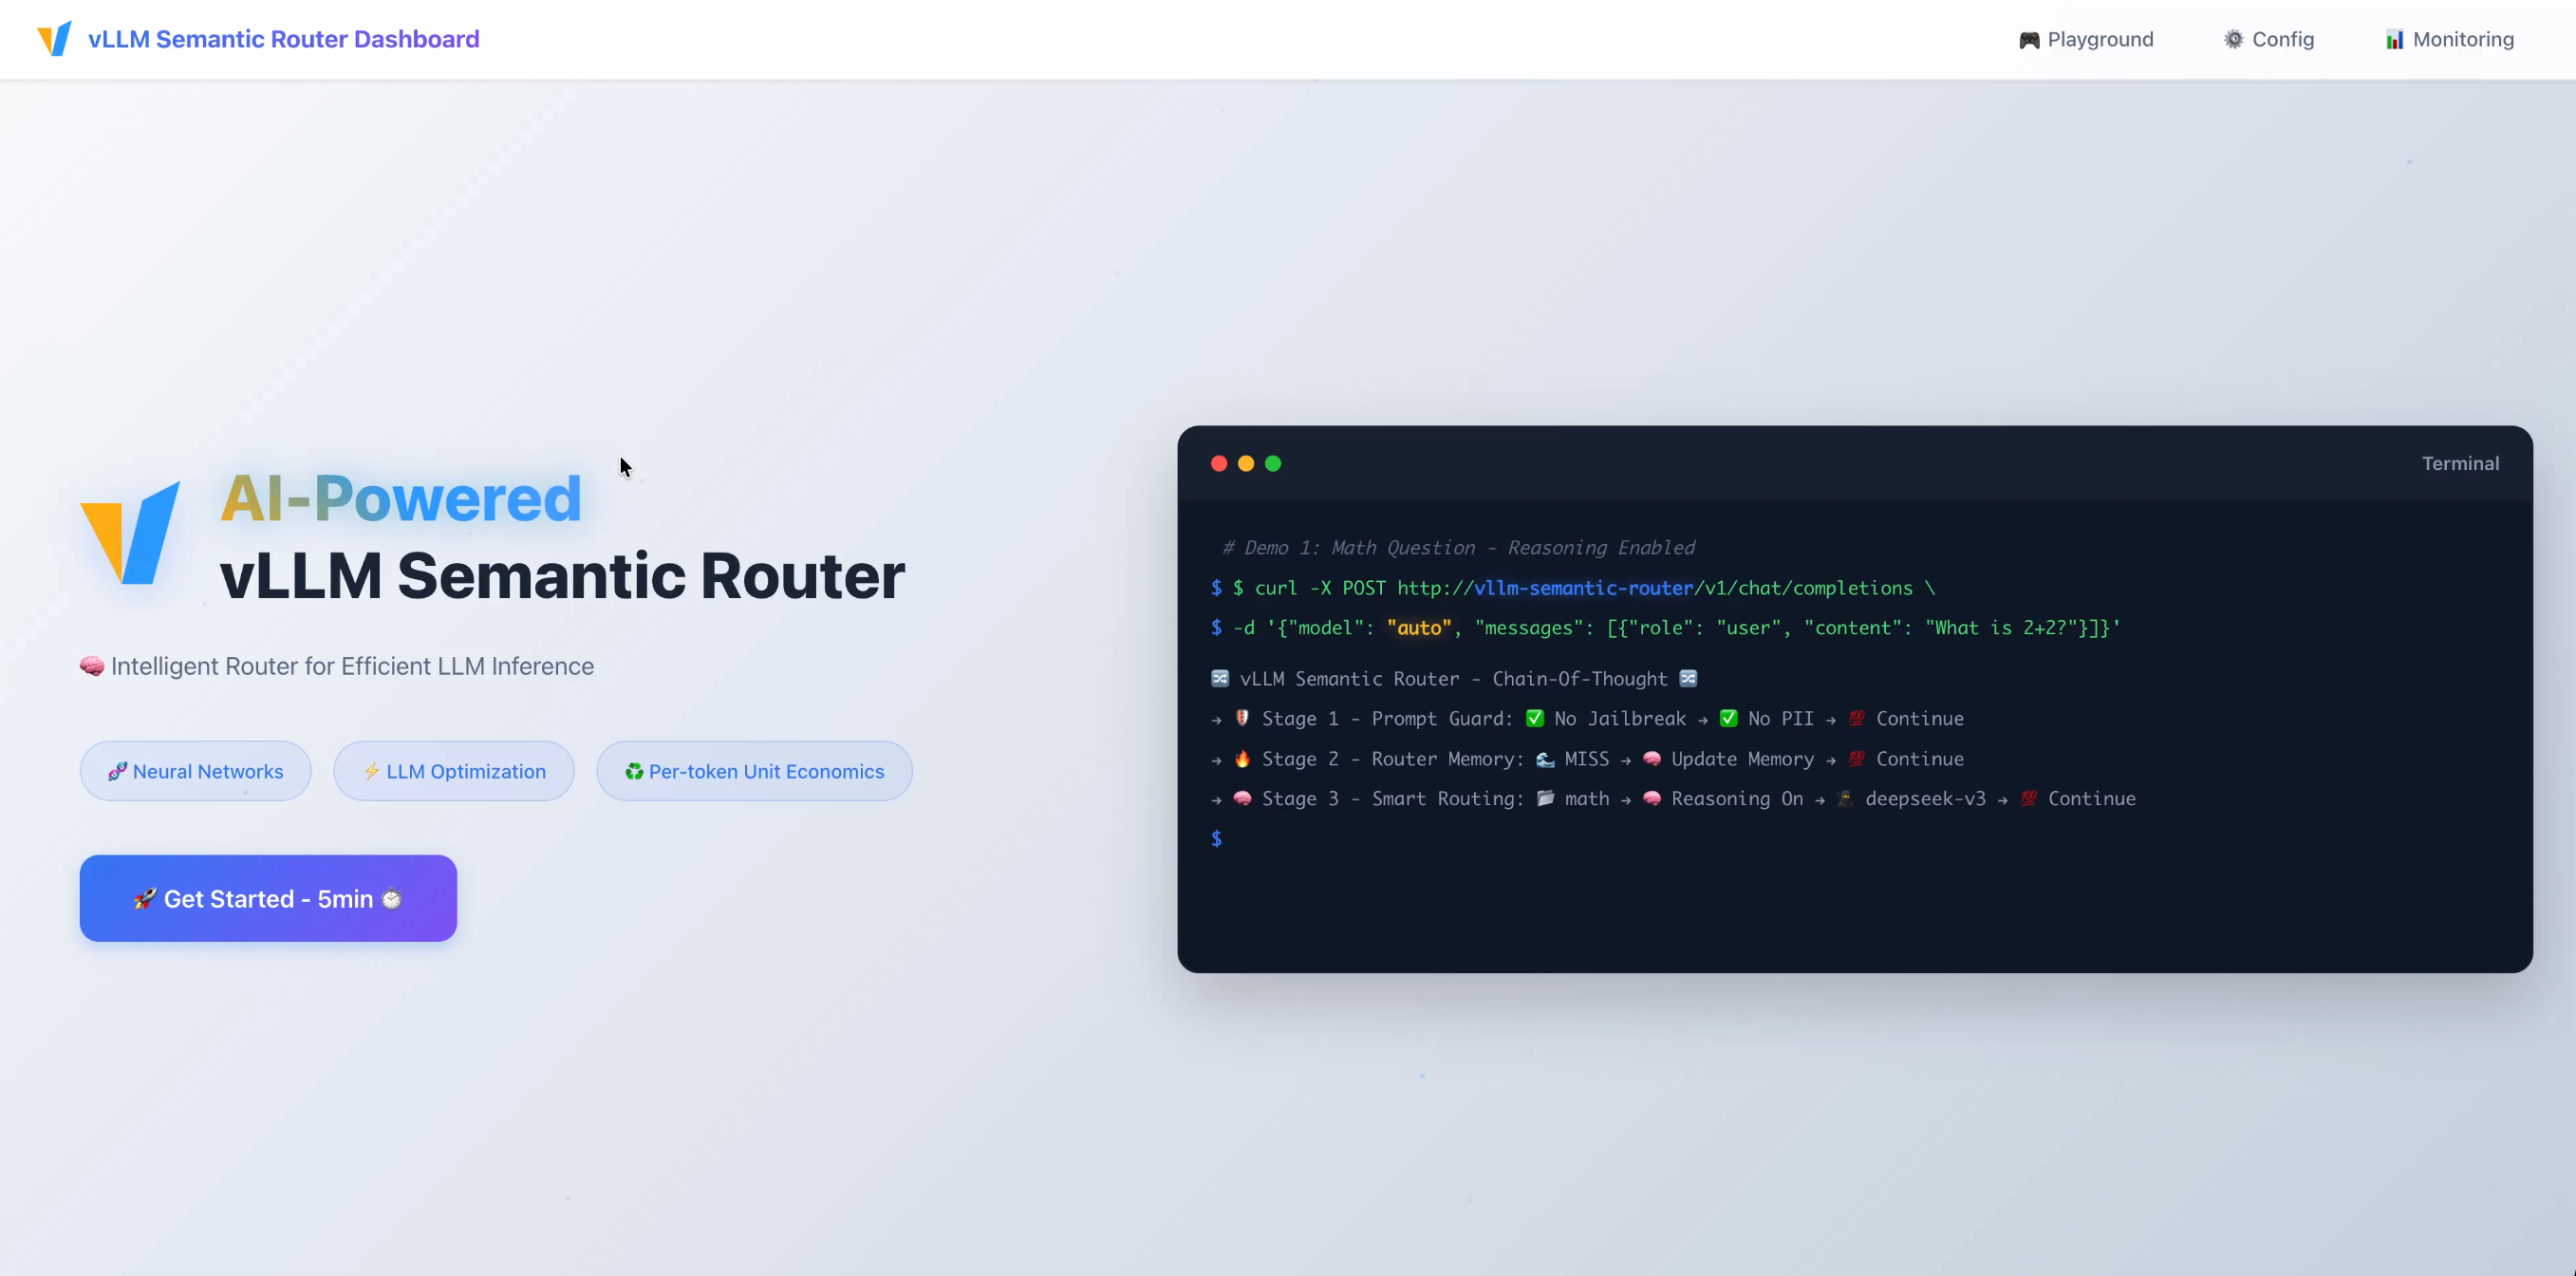
Semantic Router Dashboard
The Semantic Router Dashboard is a unified operator UI that brings together Configuration Management, an Interactive Playground, and Real-time Monitoring & Observability. It provides a single entry point across local development, Docker Compose, and Kubernetes deployments.
- One place to view and edit configuration (with guardrails)
- One tab to test prompts via your preferred UI (Open WebUI)
- One tab to view metrics/dashboards (Grafana/Prometheus)
- Single backend proxy that normalizes auth, CORS, and CSP across services
What’s inside
Frontend (React + TypeScript + Vite)
A modern SPA with:
- React 18 + TypeScript + Vite
- React Router for client-side routing
- CSS Modules, dark/light theme with persistence
- Collapsible sidebar to jump across sections
- Topology visualization powered by React Flow
Pages:
- Landing: Intro and quick links
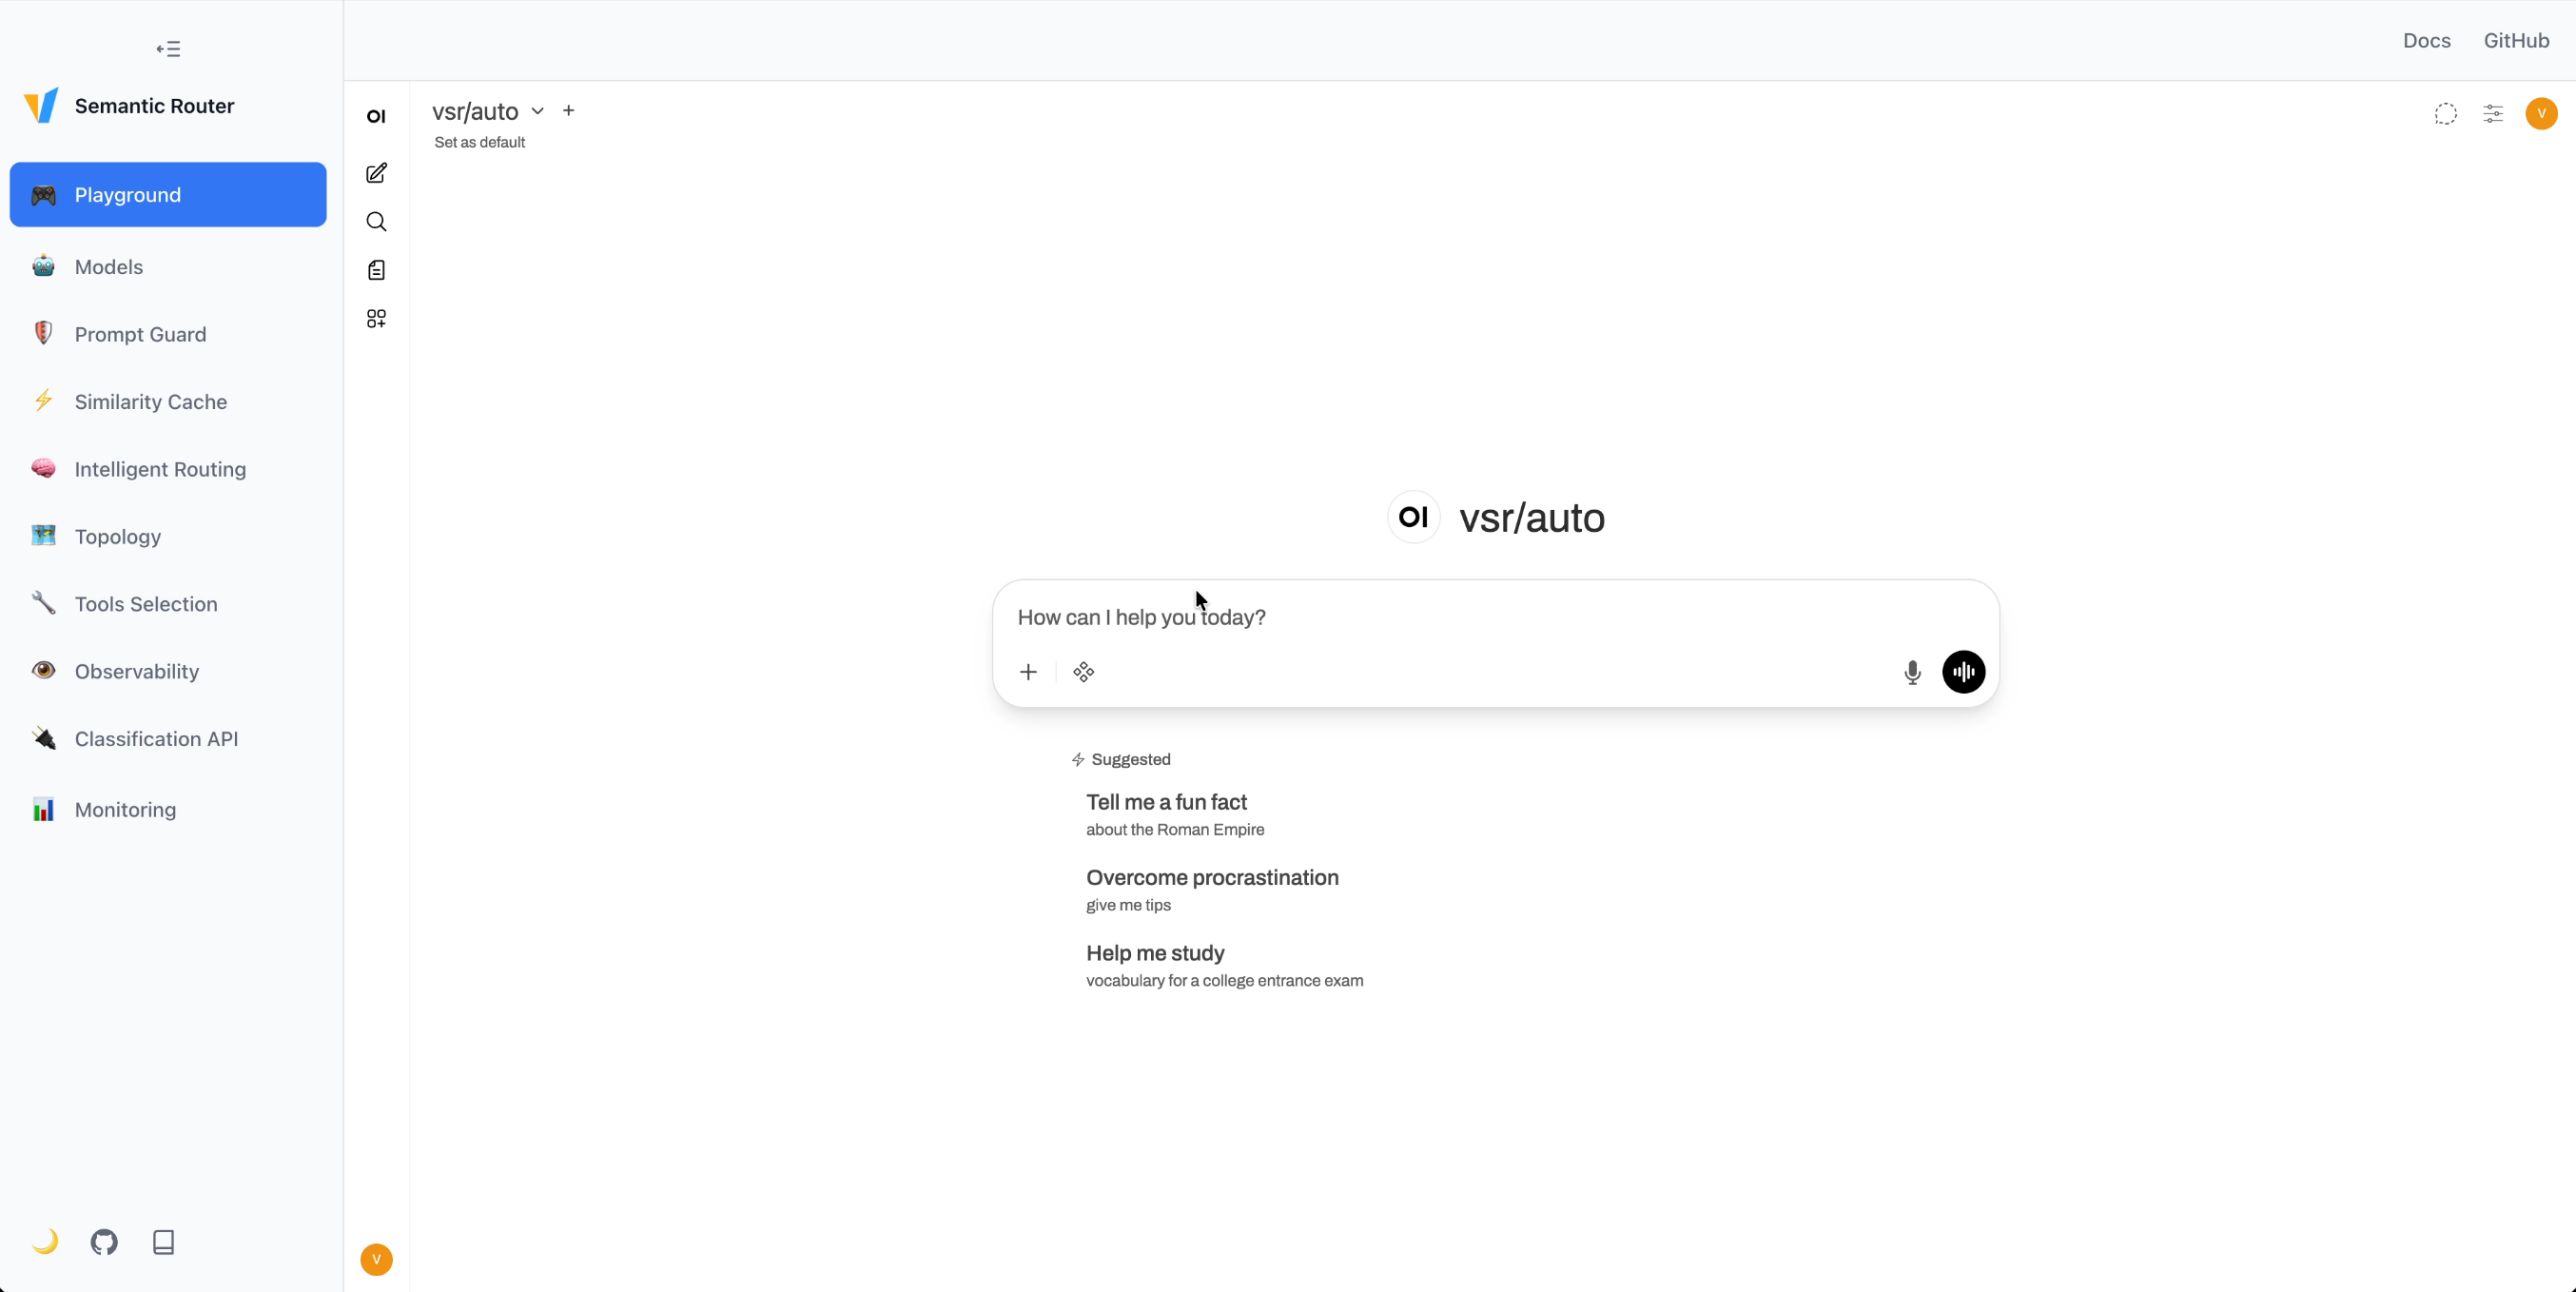
- Playground: Embedded Open WebUI for quick testing
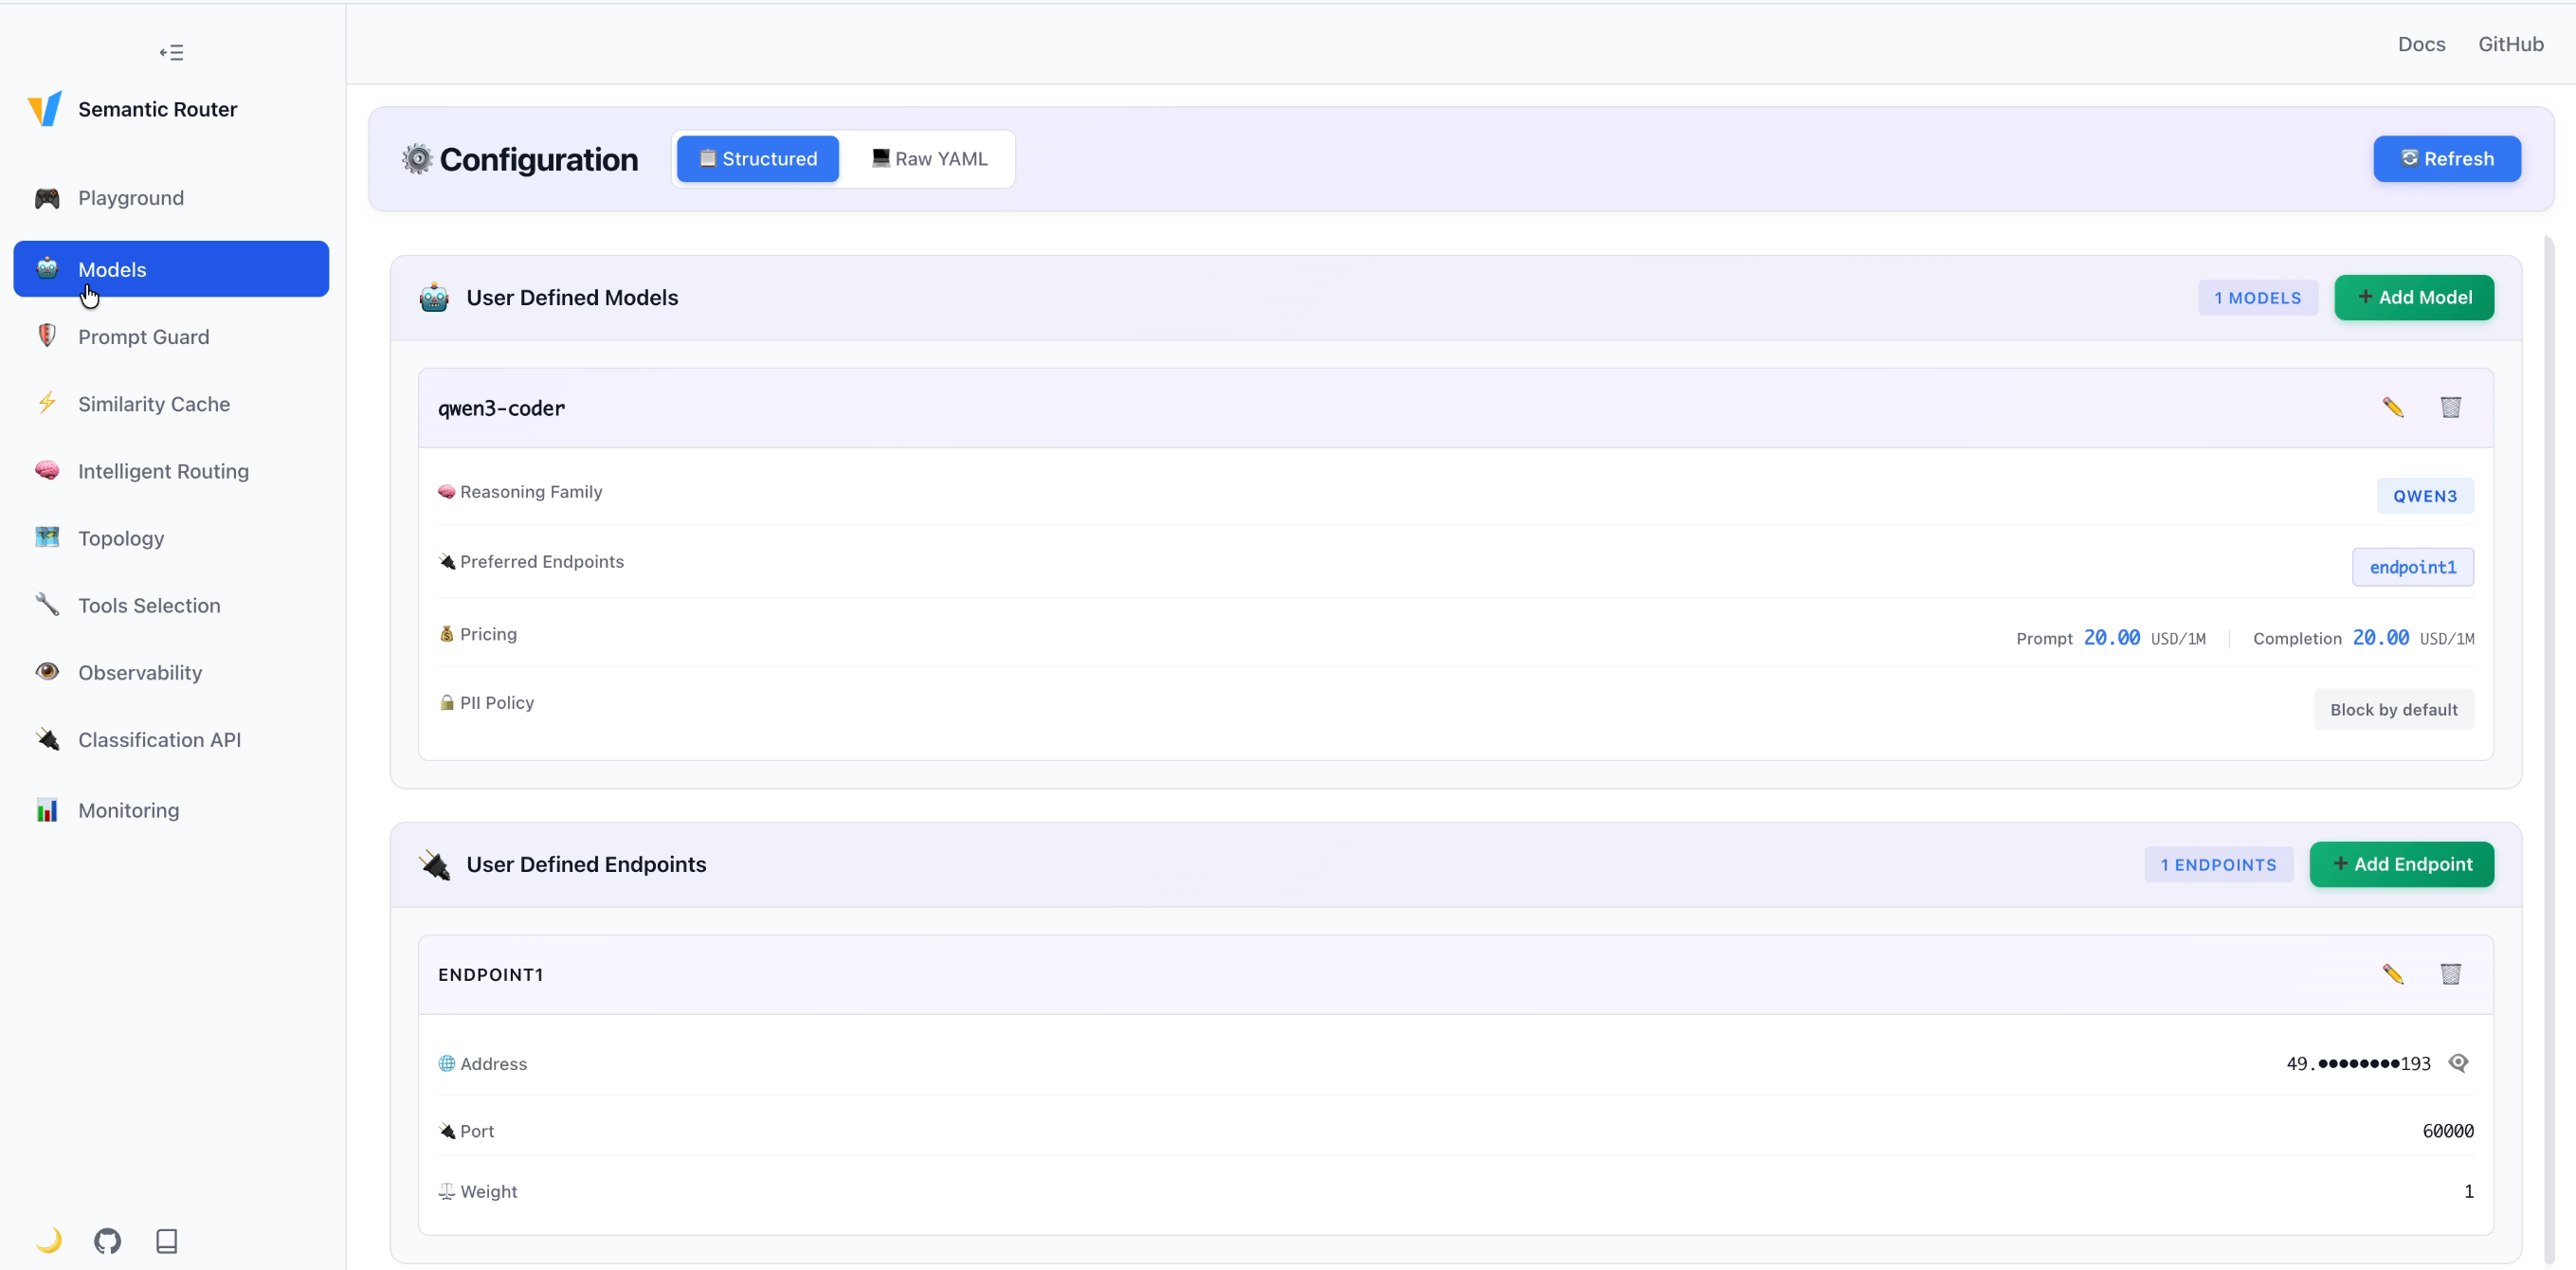
- Config: Real-time configuration viewer/editor with structured panels and raw view
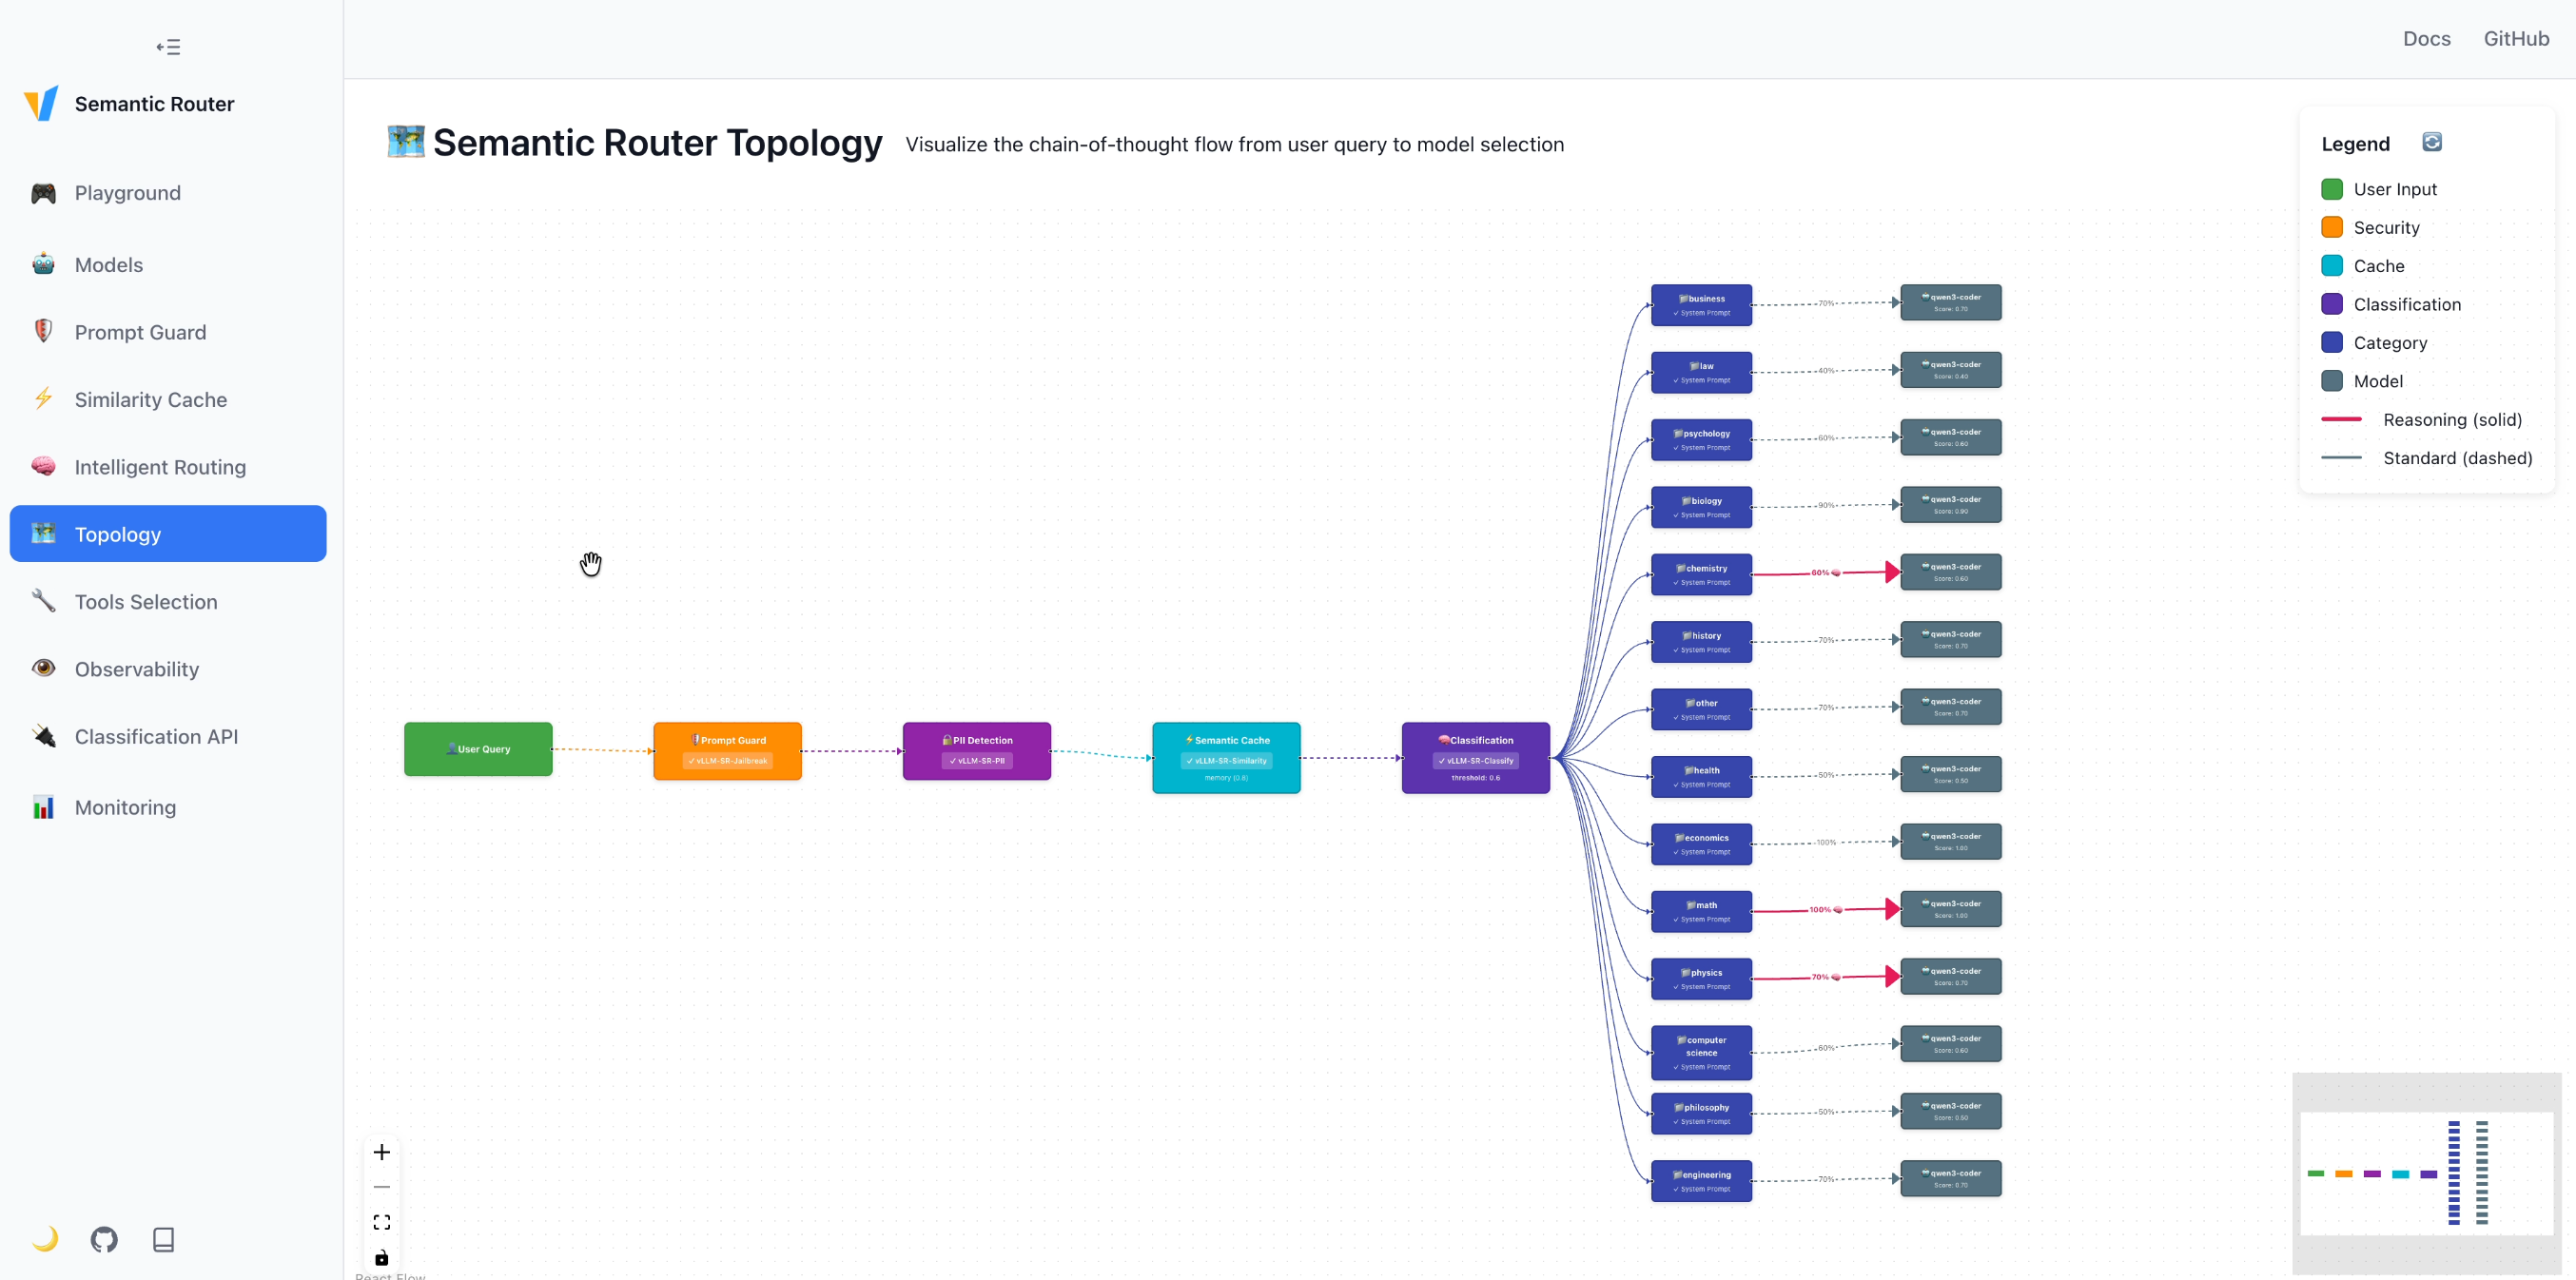
- Topology: Visual flow from user request to model selection
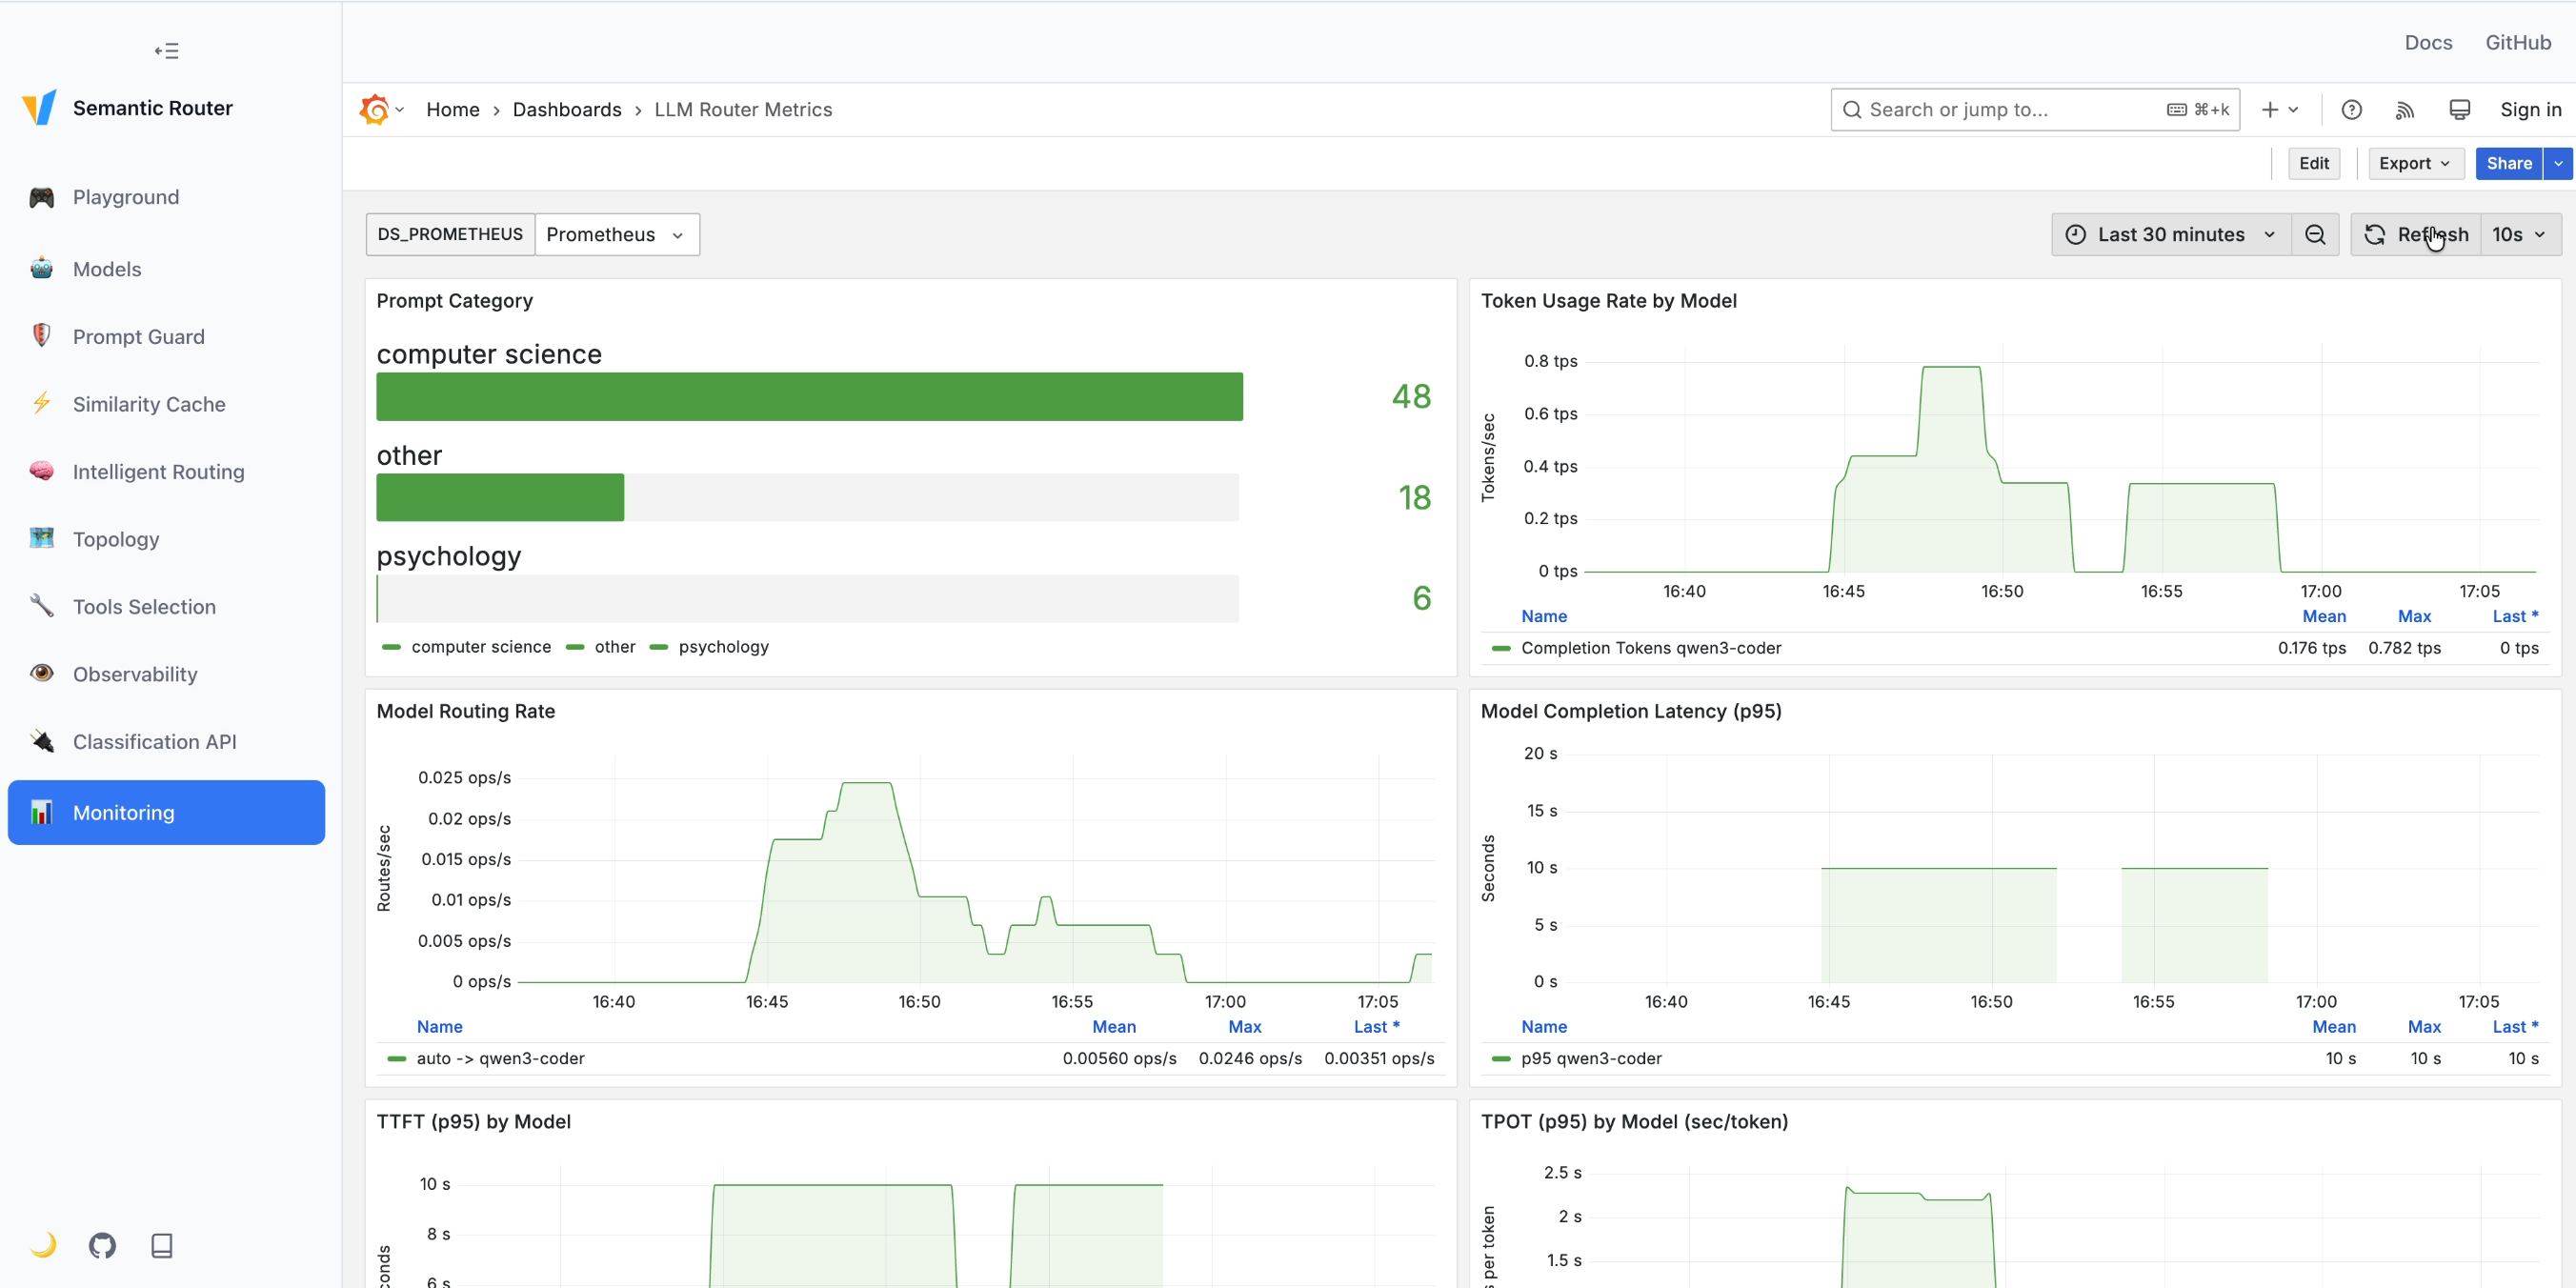
- Monitoring: Embedded Grafana dashboard
Backend (Go HTTP Server)
- Serves the frontend build (SPA routing)
- Reverse proxies upstream services with header normalization for iframe embedding
- Exposes a small set of dashboard APIs for config and tools database
Key routes:
- Health:
GET /healthz - Config (read):
GET /api/router/config/all(reads YAML, returns JSON) - Config (write):
POST /api/router/config/update(writes YAML back to file) - Tools DB:
GET /api/tools-db(serves tools_db.json next to the config) - Router API:
GET/POST /api/router/*(Authorization header forwarded) - Grafana (embed):
GET /embedded/grafana/* - Prometheus (embed):
GET /embedded/prometheus/* - Open WebUI (embed):
GET /embedded/openwebui/* - Router metrics passthrough:
GET /metrics/router→ redirects to router metrics
The proxy strips/overrides X-Frame-Options and adjusts Content-Security-Policy to allow frame-ancestors 'self', enabling safe embedding under the dashboard origin.
Environment variables
Supply upstream targets and runtime settings via env vars (defaults in parentheses):
DASHBOARD_PORT(8700)TARGET_GRAFANA_URLTARGET_PROMETHEUS_URLTARGET_ROUTER_API_URL(http://localhost:8080)TARGET_ROUTER_METRICS_URL(http://localhost:9190/metrics)TARGET_OPENWEBUI_URL(optional)ROUTER_CONFIG_PATH(../../config/config.yaml)DASHBOARD_STATIC_DIR(../frontend)
Note: The config update API writes to ROUTER_CONFIG_PATH. In containers/Kubernetes, this path must be writable (not a read-only ConfigMap). Mount a writable volume if you need runtime edits to persist.
Quick start
Docker Compose (recommended)
The dashboard is integrated into the main Compose file.
# From the repository root
make docker-compose-up
Then open in browser:
- Dashboard: http://localhost:8700
- Grafana: http://localhost:3000
- Prometheus: http://localhost:9090
Related docs
- Installation → Configuration: installation/configuration.md
- Observability: tutorials/observability/overview.md and tutorials/observability/metrics.md
- Open WebUI integration: tutorials/observability/open-webui-integration.md
- System architecture: overview/architecture/system-architecture.md